16+
DOI: 10.18413/2313-8971-2019-5-1-0-1

Correctional education development in China: an exploratory analysis of quantitative data between 2009 and 2016

Abstract

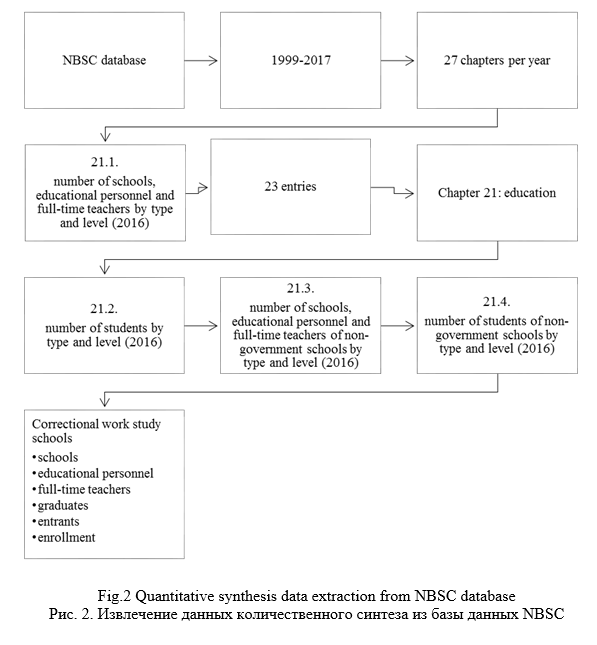
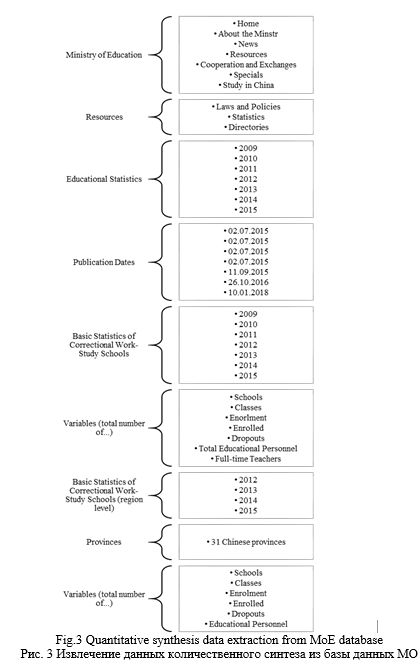
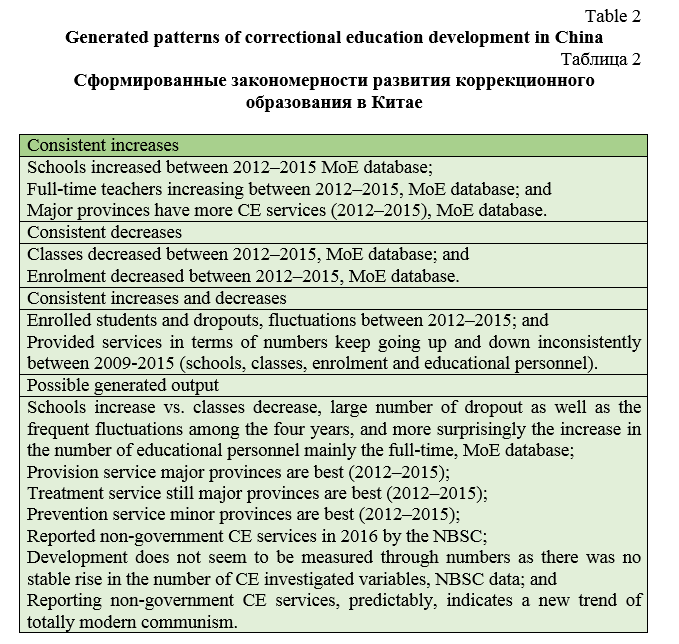
Purpose: We examined the development of correctional education (CE) in China with reference to the National Plan (2010‎-‎2020). Design: A quantitative synthesis was conducted based on a 7-‎year interval retrieved data (2009/2010-‎2015/2016) from the Ministry of Education (MoE) and National-Bureau of Statistics of China (NBSC) databases using seven indicators (schools, classes, enrolment, enrolled students, dropouts, educational personnel and full-time teachers) yet representing 31 provinces in China. Findings: The results indicated four patterns of CE development: consistent increase in CE services for some indicators (e.g. schools) – possibly implying successful provision methods; a consistent decrease in some others (e.g. classes) – probably implying impacting prevention methods; and consistent increases and decreases for a few of them (e.g. enrolment) – presumably implying effective vs. ineffective treatment methods.


Introduction. The number of prisoners is increasing worldwide. Latest reports for 2018 showed large numbers based on the World Prison Brief database (World Prison Brief [WPF], 2018). Among 223 countries, the prison population total ranged over two million to two prisoners per country. Globally, the highest countries with prison population rate for 2018 are: (US: 2,121,600), (China: 1,649,804), (Brazil: 682,901), (Russia: 595,728) and (India: 419,623).  Further, the highest three countries with prison population rate in Asia are: (China: 1,649,804), (India: 419,623) and (Thailand: 343,657) (WPF, 2018). China, the targeted country of this paper is ranked second after the US, internationally, and first in Asia. This rank of China, internationally and regionally, is paradoxical. In other words, it sounds a low percentage when compared to the US whose population is significantly lowers than China’s, but sounds reasonable when compared to China’s rank in Asia, again with reference to the population of the Asian countries, albeit, the difference between the most two populous countries in the world (i.e. China and India) is significant too (Statista, 2018). Given these large numbers of prisoners worldwide, international efforts have been taking place to reduce these numbers and help reintegrating prisoners into society. Prevention, provision and treatment programmes are provided in almost all countries under correctional education, prison education, reformatory education, etc.
CE is referred to ‘a wide variety of educational programs available to men and women under correctional supervision’ (Justice Center, Th Council of State Governments, 2018, para. 1). It usually includes: adult basic education, adult secondary education, vocational education, college coursework, special education, study release and life skills and/or competency-based education (ibid). Moreover, CE is classified into two types with different objectives for each, namely, vocational training and literacy development. The authors also state that there are basically two reasons for believing that CE programmes provision helps in crime reduction. These include ‘the impact of increased cognitive skills on changes in behavior and … participants can learn how to live a crime-free life by participating in education courses (Bazos & Hausman, 2004, p. 3). Dissimilar to the above descriptions, (United Nations Office on Drugs and Crime [UNODC], 2012) introduced CE with reference to different terminology. For instance, it is distinguished between social integration and social reintegration. While the former refers to prevention of causes that leads to the need of CE provision, the latter refers to treatment and preparation of prisoners of all types to reintegrate into the the society (UNODC, 2012: 149).
CE in China aims ‘to change prisoners’ thinking, mend their ways, raise their literate ability and develop their productive skills’ (Youfang, 1989: 69). It is just another form of special education schools-reforming offenders and helping them to re-join the society. This is in agreement with the view that one of the main reasons for China’s outperformance on CE is probably due to the followed approach and built system-based on ‘socio-cultural and rehabilitative efforts’ (Hobler, 1989: 64). In this regard, three factors were identified describing rehabilitation (i.e. reform as in China): education, labour and ideological instruction. These factors are further emphasised by (Lei, 2000) who maintained that when approaching juvenile education from a sociological perspective, four factors have to be considered: person, school, family and society.Besides, CE in China is described in comparison to other countries stating ‘states around the world have routinely drafted persons into the army during wartime, but China is notable for its long-standing tradition of peacetime conscription of forced laborers to toil on public construction projects’ (Williams & Wu, 2004: 20). Above all, a significant change for prison camp system in China has been taking place in the Republic Era. The authors assert ‘in the Republican Era, incarceration in county jails or relatively “modern” urban prisons replaced the premodern internal exile in prison camps’ (Williams & Wu, 2004: 31). The authors argued further that ‘CCP reformulated this long tradition of forced labor to suit its own aims and interests’ (Williams & Wu, 2004: 43). Additionally, all aspects of normal life should be provided for juvenile education offenders. This would enhance preparing them for normal life or at least living normal life-like including health education (Huang, Zhou, & Guo, 2007).Lastly, it is still believed that juvenile education as one of the other education areas manifests rural-urban areas gap. For instance, (Keqin, 2008) examined juvenile education of urban families in Harbin and it was observed that specific policies and regulations should be enforced to balance gaps between rural and urban juvenile education. This goes with the view that reformatory education is not just a concept, it is a rather a practical method that should be considered by police administration through transforming prisoners (Feng, 2009).
The present study. China’s CE system has been either optimistically viewed as ‘vastly effective in its efforts’ (Hobler, 1989: 68) or pessimistically as ‘having the biggest penal colony in the world’ (Decu, 2013: 46). We examine this claim based on quantitative synthesis using retrieved data from both MoE and NBSC databases between 2009/2010‎ and ‎2015/2016 with reference to the National Plan where it is stated “moral education for juveniles and ideological and political education for college students should be enhanced”(Ministry of Education, People's Republic of China, 2010: 10) and “to tone up the system for punishing criminal offences and preventing corruption in ways that give expression to the distinct attributes of the education system” (ibid, p. 0). Thus, it is hypothesised that there will be (no) statistically a significant difference between:
H0/HA: … the total number of CE schools, classes, enrolment, enrolled students, dropouts, educational personnel and full-time teachers between 2009/2010 and 2015/2016 at a 7‎-‎year interval;
H0/HA: … the total number of male and female CE enrolment, enrolled students, dropouts, educational personnel and full-time teachers between 2009/2010 and 2015/2016 at a 7‎-‎year interval; and
H0/HA: … the total number of CE schools, classes, enrolment, enrolled students, dropouts, educational personnel and full-time teachers among 31 Chinese provinces between 2009/2010 and 2015/2016 at a 7-‎year interval.
Methods. Sample. Having used secondary data, so there is no direct intrusion with humans in our study. Given this, our theoretical population is correctional population; the study population is CE community in China; the sampling frame includes all types of offenders including juveniles in addition to educational personnel of CE; and the sample includes: total number of CE schools, classes, enrolled students, dropouts, total enrolment, total educational personnel and full-time teachers between 2009/2010 and 2015/2016. Hence, with the presented sample, we hope to give a general picture with a quantitative synthesis evidence about the development of CE in China with reference to the National Plan 2010-‎2020. While these quantitative-based indicators could hopefully predict the development of CE in China, the analysis has neither the intention to examine the quality of CE nor is intended to evaluate other related factors (e.g. learning environment, curriculum, CE output, etc.) as these go beyond the collected data in this study.
We used unobtrusive measures, mainly, secondary analysis of census bureau data to examine the proposed hypotheses on CE development in China between 2009/2010‎–‎2015/2016 with reference to the National Plan 2010‎–‎2020.
Design
We used a non-experimental design; it can be depicted in notational form as:
X       O
where:
X= the unobtrusive measure (i.e., census data for 7 years)
O= CE in China between 2009-2015 MoE and 2010–2016NBSC
With this design, it is presumably assumed that there will be a statistically significant difference over the 7 years, especially in 2009/2010 and 2015/2016. The total number of CE schools, classes, entrants, enrolled students, dropouts, educational personnel and full-time teachers would be significantly different in 2015/2016 as compared to2009/2010. This would allow inferring some implications in regard to prevention, provision and treatment in regard to CE development in China.
Procedure
In March 2018, we used the official website of the Ministry of Education to access data about CE in China (http://en.moe.gov.cn/). Although the major purpose was to retrieve data from 2009 till 2018 but the provided data was not complete. In other words, only the data for 2012‎-‎2015 was available for the number of CE schools, classes, enrolment, enrolled students, dropouts, educational personnel and full-time teachers along with data for CE for females for the same variables. The website also included data for the CE of the same variables for 31 provinces from 2009‎–‎2015. We conducted a further research on the NBSC website (http://www.stats.gov.cn/english/) and generated more data. Several communications through the first website asking about data for the last three years did not result to any reply. For this reason, only the available data until the year 2015 from the MoE and until 2016 from the NBSC was reachable yet included.

Results. Table 1 presents the total number of CE schools, classes, enrolment and staff across 2009‎-‎2015 in China. It was proposed that the highest numbers in all variables will be for 2015 and lowest will be for 2009. While the data shows 76 as the lowest number of schools, the data indicates that this number is for 2010 which is not the starting comparison point across seven years. On the other hand, it reports 89 as the highest number of schools and the data also indicates the same number for the ending comparison point (i.e. 2015). Interestingly, the lowest number of the classes which is reported as 331 in the table matches with the ending point of comparison, 2015 as compared to the largest number of classes 445-matching the first point of comparison, 2009. This also applies to enrolment where the numbers are reversed to the largest number of enrolment in 2009 and the smallest number in 2015. All in all, this indicates inconsistent development of CE services as per indicated by ups and downs of numbers in the above examined variables.

Besides, the 2016 data from the NBSC database also showed inconsistent numbers when being compared to the period 2009‎-2015. In other words, the highest numbers in 2016 and the lowest in 2009 were shown only on schools (Range: 72-89) and full-time teachers (Range: 1745‎-2081) – compared to others which revealed decreases for 2016 as in the highest number for educational personnel is for (2015=3,017) compared to (2016=2,889). Similarly, the graduates, entrants and enrolment all decreased in 2016 (3,298; 3,295; 7,181) respectively as compared to (4,141; 3,811; 7,920) in 2015. Interestingly, the date also reported non-government CE services in 2016 (schools=3), (educational personnel=85), (full-time teachers=68), (graduates=42), (entrants=47) and (enrolment=48)—without any provided data for the previous years unless this is an emerging phenomenon in China. Thus, this could possibly indicate efficient and effective prevention methods leading to decrease the need for provision of correctional education. This could be social justice factors, crime decrease or better employment chances.

Figure 4 shows the type of relationship between schools and classes over 7 years. As is shown, the red line representing the classes keeps moving down while the blue line keeps moving up, albeit, this movement is relative. Given this, the type of pattern which can be recorded is opposite movement. The number of the classes decreases when the number of the schools increases and vice versa.

Fig. 5 shows the type of relationship for enrolment and then enrolled students and dropouts over 7 years. As is seen, while the movement between enrolment and the other two variables is opposite (increase in enrolment leading to decrease in enrolled students and dropouts), the movement between enrolled students and dropouts is parallel (i.e. they both go up and down within the same level). Therefore, the parallel movement between the enrolled students and dropouts leads to a prediction about a shortcoming issue of CE services leading to have relative numbers of enrolled and dropouts.

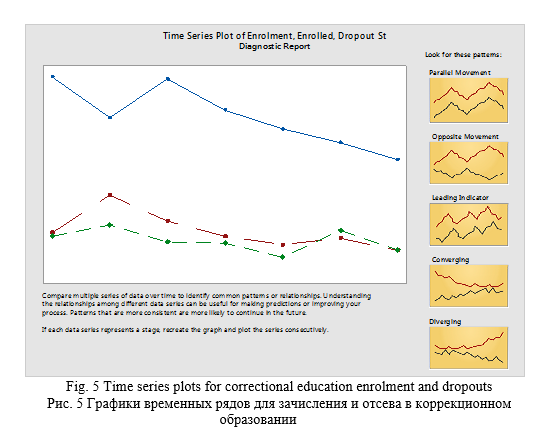
Fig. 6 presents the comparison for female enrolment in CE over 7 years. As is shown, the type of movement between enrolment and the enrolled and dropout student seems to be converging where the blue line starts too far from the red and green line but they are about to reach one another at the ending point. On the other hand, when comparing the enrolled students and the dropouts, there is no observed consistent pattern although it looks like an opposite movement in some of the patterns.

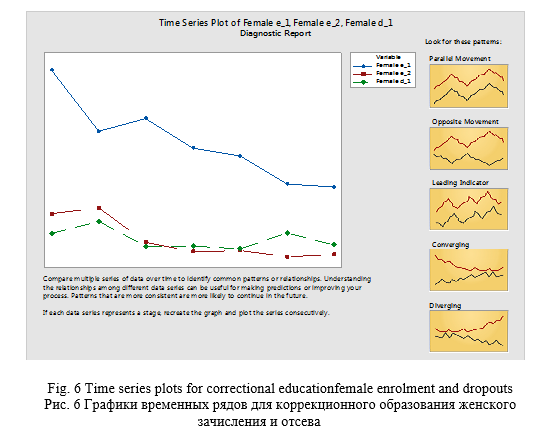
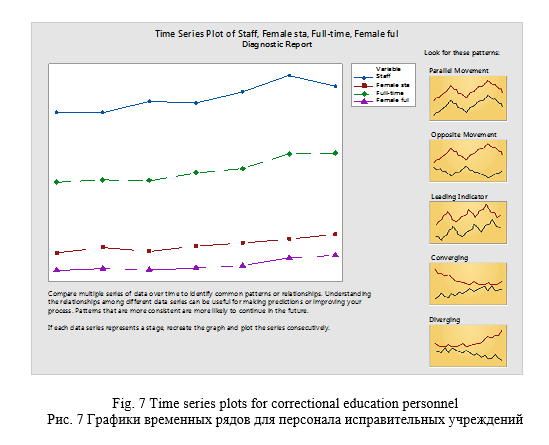
Fig. 7 displays a comparison of CE staff (i.e. educational personnel and full-time) and female CE staff (i.e. educational personnel and full-time) at a 7-year interval. It seems that the recoded type of movement is more parallel where the movements go within the same direction among all the patterns, albeit, this consistency is relative.

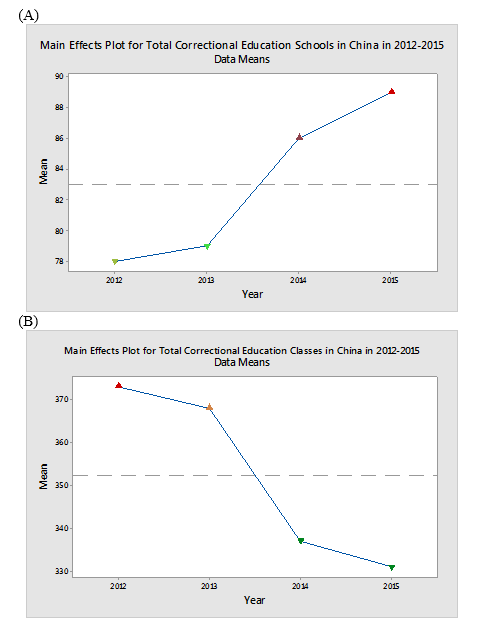
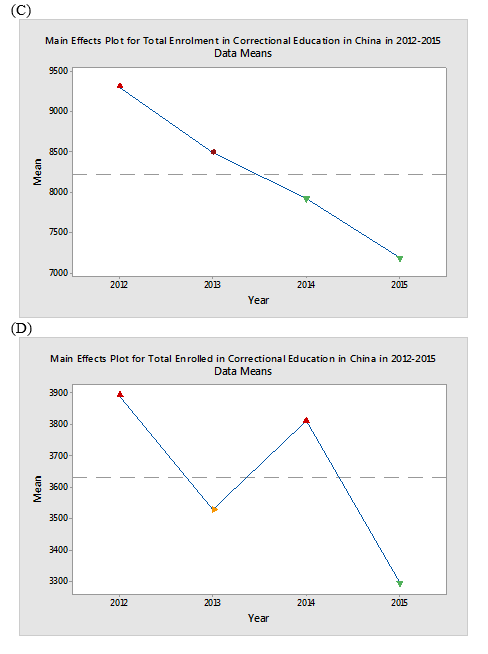
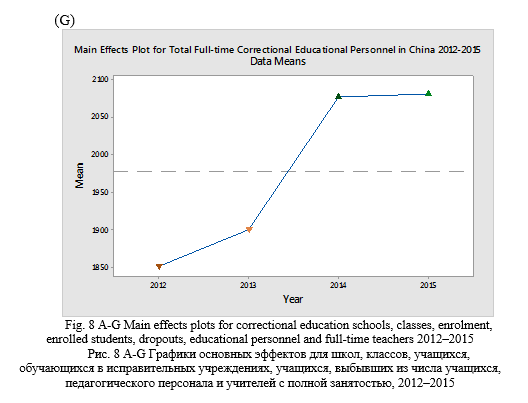
Graphical analysis was run – generating main effects plots – comparing the differences among the means of correctional education schools, classes, enrolment, enrolled students, dropouts, educational personnel and full-time educational personnel – looking for indicators of differences across 2012-2015 (Figure 8A-‎G). As is shown, variable differences among the means of correctional education were recorded. First, there is difference among the total number of correctional education schools and classes across 2012-2015. However, it was noted that while the number of the schools increased, the number of the classes was decreasing. Second, enrolment generally kept decreasing to reach its big fall in 2015. Therefore, when comparing the total number of enrolled students to dropouts, there were fluctuations in both. Third, the number of educational personnel kept going up and felt down moderately in 2015 as compared to the full-time staff which kept going up until 2015. Although there are recorded differences across the four years, but there are some contradictions (e.g. schools increase vs. classes decrease, large number of dropout as well as the frequent fluctuations among the four years, and more surprisingly the increase in the number of educational personnel mainly the full-time).

Boxplots were generated to show the main differences of seven correctional educational variables across 2012-2015 in thirty-one Chinese provinces (Figure 9A–‎G). These seven variables are: correctional educational schools, classes, enrolment, enrolled students, dropouts, educational personnel and full-time educational personnel. As is shown, there are types of boxplots in each boxplot: red, blue and empty boxplots. In other words, the red boxplots represent the province with the highest number of correctional education schools, classes, enrolment, enrolled students, dropouts, educational personnel and full-time educational personnel. In comparison, the blue boxplots display the average provinces which are neither zero (as in the case of empty boxplots) nor high as in the case of red boxplots. In summary, the initial indications of these boxplots show either consistent increase or decrease in the distribution of correctional education services. Put differently, if we look at Shanghai province boxplots, so they will be high in the seven variables. Besides, we will see in the discussion if the distribution is really even when compared to the population in each of the 31 provinces.

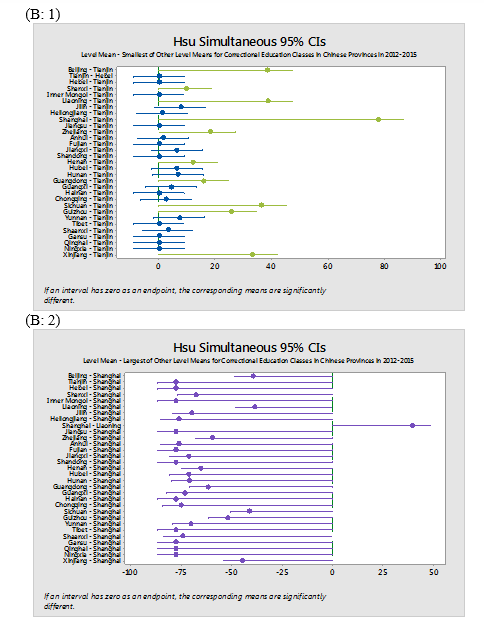
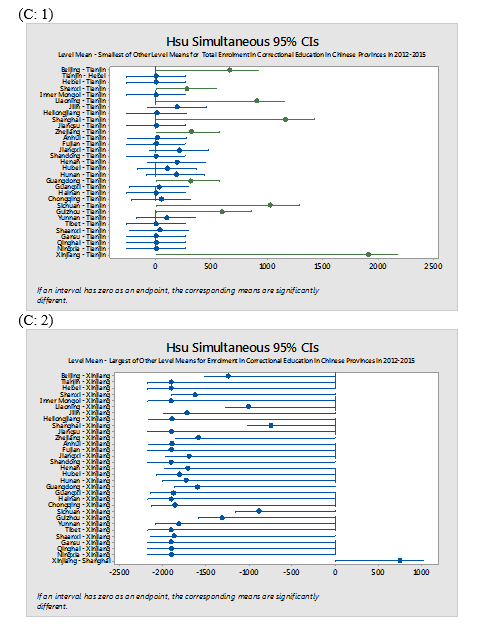
Hsu method was run to determine if the differences among each variable for the thirty-one provinces are due to provision and treatment or other factors. The Hsu was method was run twice first with the function the smallest mean is the best and then with the function the largest mean is the best (Figure 10A-‎G). Theoretically, if the means are small it means the level of correctional education is small due to effective provision and treatment methods and if the means are high it means the opposite. As is shown, all means are considered significant when highest is considered the best. On the other hand, the number of significant means goes significantly down when the smallest mean is considered as the best. Considering the fact that this change could be attributed to population differences in each province, so the assumption of provision seems to be weak with this secondary data.


Discussion. Apparently, the results of this study were partially contradicting our proposed assumptions. Put differently, two of the three null hypotheses were accepted – leading to reject the first and the second alternative hypotheses assuming that there will be statistically significant differences in the examined CE indicators at a 7-‎year interval. On the other hand, the third null hypothesis was rejected – resulting to accept the alternative hypothesis based on geographical typology that there is a significant difference among the 31 Chinese provinces in terms of the examined seven CE indicators. The output is summarised in the table below:

Given the above findings, there are at least three possible explanations. First and if we accept the assumption that our used variables and the data supporting them from the two databases (MoE and NBSC) are indicators of CE development, then the numerical evidence should show normally significant yet consistent increase in the numbers across 2009‎–‎2016. This assumption was clearly refuted. Following this trend, it could be assumed that a smaller number of enrolled students, teachers, means a better prevention of CE needs and or provision. On the other hand, more enrolled students and teachers, means either absence or less effective prevention, provision and or treatment methods. This assumption vanishes when we shift our analysis to the macro level and link this output to population percentages on the provinces. Simply say, the large numbers of CE students and teachers are impacted by the number of the population. Logically, more population, means more services are required including CE ones. To this end our attempt to assess prevention, provision, treatment of the population of CE seems to be weak with this generated evidence, albeit, it establishes a cornerstone for a further research.
Second, CE population basically includes offenders with different types of minor and major crimes including juvenile offenders. By this means, the population of this type of education is as nearly vivid as that of the normal education system (i.e. basic education, higher education, special education, and vocational education). If we accept the logical statement: [more population means more CE population], this can lead us to infer that countries with the largest populations have the largest CE populations. The first top populous countries excluding independent territories are: (China: 1,415,045,928), (India: 1,354,051,854), (US: 326,766,748), (Indonesia: 266,794,980) and (Brazil: 210,867,954) (Worldometers, 2018). This contradicts with the top five countries with CE populations for 2018: (US: 2,121,600), (China: 1,649,804), (Brazil: 682,901), (Russia: 595,728) and (India: 419,623) (WPF, 2018). The logical statement is no more valid with this evidence. If population increase does not lead to the causes of CE provision as inferred above, then there must be other factors controlling the need of provision for CE. These could be attributed to prevention, provision and treatment. Since, China, the largest populous country is not reported as the largest one with CE population, it means their prevention, provision and treatment methods are more efficient and effective than those which showed less total population but incredibly higher CE population (e.g. the US and the EU countries in total) (WPF, 2018; Worldometers, 2018; Hawley, Murphy, & Souto-Otero, 2013).
Third, although this study did not aim at approaching CE in relation to other impacting factors like political system, Human Development Index, etc. but they can be analytically linked to the current generated output of CE in China. Among the five competing political systems internationally: monarchy, communism, democracy, republic and dictatorship (Political Science Degree, 2018), either – or could possibly affect the number of CE population. Since democracy and republic seem to be very much promoted – claiming them to serve the human rights more, the number of countries with those political systems should have been with less CE populations. On the contrary, countries like China showed less CE population than that of the US, EU countries, etc. Additionally, social justice or sociological structure, following a sociology-based view, might be also other factors contributing to the success of CE system in China as compared to the North American countries and western countries, theoretically.
Conclusion and Recommendation. The National Plan 2010‎-‎2020 (Ministry of Education, People's Republic of China, 2010) seems to be in queue with the reached findings in this study. However, CE, we argue, should be included as a major part of education reform or even sub-included with special education. A possible controlling framework for developing CE could be through prevention, provision, and treatment. Prevention includes provision of factors that can prevent the emergence or need for CE. These basically include: basic education, higher education and social justice. When prevention fails, provision starts taking place and provision of CE services should include treatment. This treatment is controlled by inclusion. Inclusion has two levels: external and internal. The former refers to external inclusion of every person in the society, work, education, etc. as fairly as possible and this could be a preventive method for the need of CE provision. The latter refers to inclusion of offenders in the prison community. In this last situation, it includes again integration and reintegration. While integration refers to the ability of the provided CE service to integrate them into the prison community or say – micro-society; the latter refers to again the ability of the CE system and the conducted treatment to reintegrate them into the normal community or say – macro-society. Further research, should examine CE using more credible methods such like a systematic review.
Conflict of interest. There is no conflict of interest.


Reference lists

Bazos, A., and Hausman, J. (2004), Correctional education as a crime control program. Retrieved from https://cdcr.ca.gov/Reports/docs/External-Reports/Correctional-Education-as-crime-control.pdf (Accessed 12 December 2018).
Justice Center, (2018), Th Council of State Governments. Correctional education. Retrieved from https://csgjusticecenter.org/corrections/correctional-education/.(Accessed 19 December 2018).
Decu, A. (2013), The aftermath of dissident re-education: A comparative approach of Romania's pitesti phenomenon and the Chinese labour camps. Revista Bibliotecii Nationale, 19 (1), 46‎–‎49. Retrieved from https://search.proquest.com/docview/1704868918?accountid=8554 (Accessed 22 November 2018)
Feng, D. (2009). On reformatory educationin police's prison: Education and transformation work. Journal of Liaoning Police Academy 55(3), 77‎–‎79. Retrieved from http://oversea.cnki.net/kns55/default.aspx (Accessed 02 January 2019).
Hawley, J., Murphy, I., & Souto-Otero, M. (2013). Prison education and training in Europe: Current status of play and challenges. Retrieved from http://ec.europa.eu/dgs/education_culture/repository/education/library/study/2013/prison_en.pdf (Accessed 22 November 2018).
Hobler, B. (1989). Correctional education in the People's Republic of China. Journal of Correctional Education, 40(2), 64‎–‎69. Retrieved from http://www.jstor.org/stable/23294109 (Accessed 03 January 2019).
Huang, X., Zhou, M., & Guo, Y. (2007). Evaluation of the effect of health education and behavioral interventions for STD/AIDS prevention among adolescents detained in juvenile education institutes in Guangzhou. Chinese Journal of AIDS and STD, 13(2), 139‎–‎140. Retrieved from http://oversea.cnki.net/kns55/ (Accessed 22 November 2018).
Keqin, L. (2008). The investigation on juvenile education and analysis of restrive factors of urban families in poverty. Master thesis, Harbin Institute of Technology. Retrieved from http://oversea.cnki.net/kns55/ (Accessed 02 January 2019).
Lei, J. (2000). Case study analysis of problem juvenile: Education in sociology. Chinese Journal of Special Education (Quarterly), 26(2), 43‎–‎45. Retrieved from http://oversea.cnki.net/kns55/default.aspx (Accessed 19 November 2018).
Ministry of Education, People's Republic of China. (2010, July). Outline of China’s national plan for medium and long-term education reform and development (2010‎–‎2020). Retrieved from https://internationaleducation.gov.au/News/newsarchive/2010/Documents/China_Education_Reform_pdf.pdf (Accessed 19 November 2018).
Political Science Degree. (2018). The five most common political systems around the world. Retrieved from https://www.politicalsciencedegree.com/the-five-most-common-political-systems-around-the-world/ (Accessed 22 November 2018).
Statista. (2018). Crime and penitentiary system in China: Statistics and facts. Retrieved from https://www.statista.com/topics/2253/crime-and-penitentiary-system-in-china/ (Accessed 20 November 2018).
United Nations Office on Drugs and Crime. (2012). Introductory handbook on the prevention of recidivism and the social reintegration of offenders. Retrieved from http://www.unodc.org/documents/justice-andprisonreform/crimeprevention/Prevention_of_Recidivism_and_Social_Reintegration_12-55107_Ebook.pdf (Accessed 22 November 2018).
Williams, P., & Wu, Y. (2004). The cultural foundations of China’s prison camp system. In The great wall of confinement: The Chinese prison camp through contemporary fiction and reportage (pp. 17‎–‎34). Los Angeles, LA: University of California Press. Retrieved from http://www.jstor.org/stable/10.1525/j.ctt1pnrnr.6 (Accessed 13 November 2018).
Worldometers. (2018). Countries in the world by population (2018). Retrieved from http://www.worldometers.info/world-population/population-by-country/. (Accessed 23 November 2018).
World Prison Brief. (2018). Highest to lowest: Prison population total. Retrieved from http://www.prisonstudies.org/highest-to-lowest/prison-population-total?field_region_taxonomy_tid=All (Accessed 24 November 2018).
Youfang, Z. (1989). Education of prisoners in the correctional system in China. Journal of Correctional Education, 40 (2), 69‎–‎70. Retrieved from HYPERLINK http://www.jstor.org/stable/23294110 (Accessed 22 November 2018).